
Or: How can an electric scooter ride-sharing company like Bird possibly make money?

If you live in a select number of cities in the U.S., it’s hard not to see electric scooters appearing on sidewalks all over the place. Electric scooter ride-sharing services are also remarkably cheap: $1 to start a ride and another $0.15 per minute after that. But electric scooters aren’t cheap, and the logistics of a shared network are off-the-charts complicated. How does an electric scooter ride-sharing company like this possibly make money? As someone working in venture capital for hardware startups, the above question is obviously rather prescient.
How does a company like this possibly make money?
In this blog post, I’ll take a closer look at the basic unit economics of Bird, an electric scooter ride-sharing company based in Santa Monica, CA. We’ll build a super simple model and test scenarios that show how critical it is to understand and manipulate the key levers of your startup — in fact, it can determine whether your business sinks or swims.
Building a Scooter

It looks like Bird is using the Mi Electric Scooter as the base of their platform. The Mi’s recommended retail price is $499, but it’s probably fair to assume that Bird gets a bulk discount and can buy the scooters at around $300 apiece.
On top of the base cost of the scooters, Bird needs modules to turn the scooters into sharing economy units. That doesn’t have to cost a lot of money. A Particle 3G asset tracker in a box, plus some custom code to deal with the scooter’s power management, is all that’s needed, so let’s call that $80 per unit. That takes the total cost per finished scooter to $380; plus, we’ll toss in $20 for final assembly.
My back-of-the-envelope calculation puts Bird’s road-ready scooter at $400 per unit.
Deploying a scooter
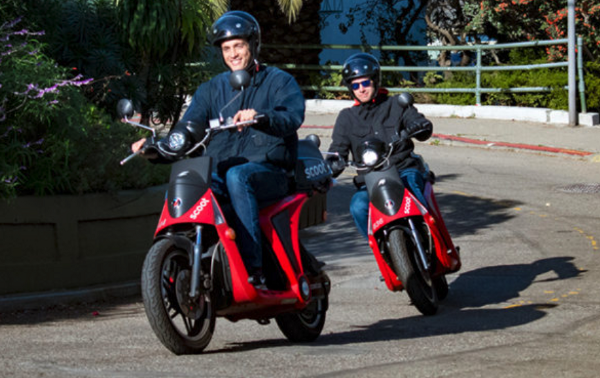
One of the biggest problems electric scooter companies must solve is distributed charging. Scoot solved this problem by building a massive network of charging stations, distributed around San Francisco — a big infrastructure push, but necessary, given the robust profile of the scooters. Unlike Scoot’s wheels, which need to be returned to a charging station for charging, Bird scooters can be easily picked up and taken inside a user’s apartment or office, creating an instant and nearly infinite distributed charging network called “available wall sockets.”
This completely changes the charging game in Bird’s favor, so much so that Bird offers people $5 per charged scooter. This creates an elegant user experience and is a sign that it’s a key lever in their financial model.
A tale of two financial models
A lot of assumptions go into building a financial model. This one came together over a few beers on the weekend and is an example of the kind of “quick and dirty” math all founders should do as they pressure test ideas. You can follow along in this spreadsheet, and if you want to experiment with the numbers, you can duplicate the sheet and plug in your own numbers.
For both models, we’ll assume the following:
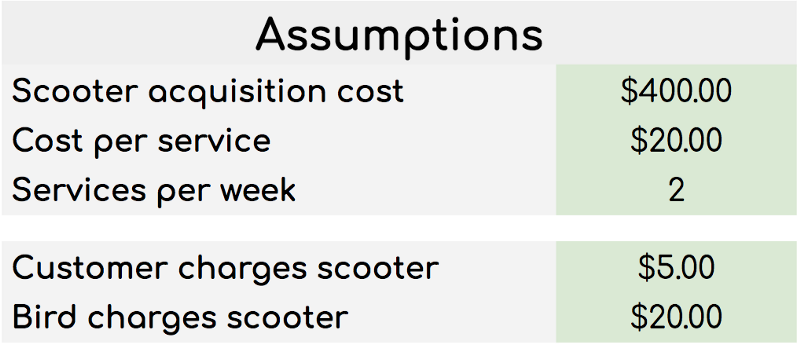
We’ll be playing with the average lifetime of a scooter, the average number of rides customers take per day, and some metrics around charging, to see how that effects gross margin.
Model 1: Uh-oh, this looks like trouble.
For the first model, let’s look at these dynamics:
- Average lifetime rides per scooter — 300
- Average rides per scooter per day — 5
- Average ride length — 20 minutes
- Percent of consumer charges: 50%
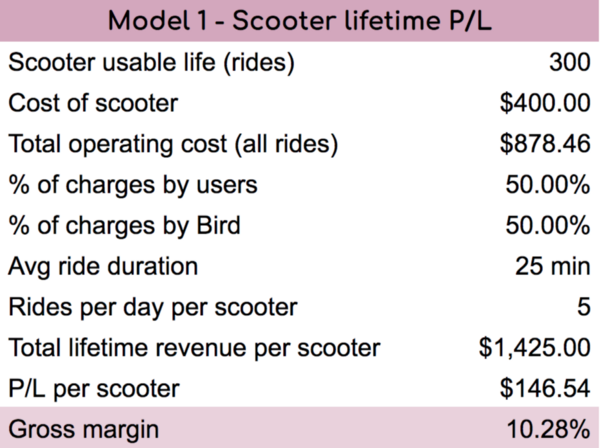
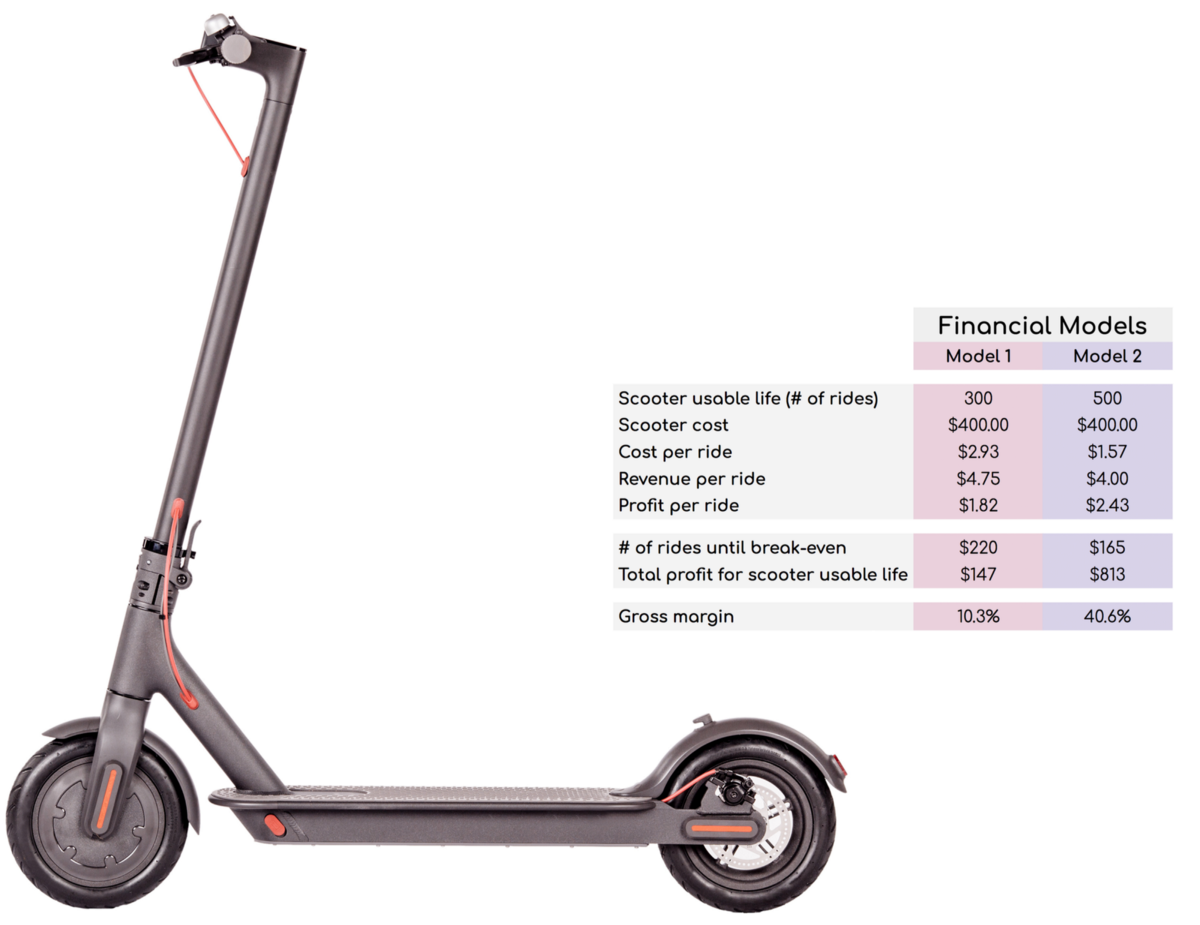
If those assumptions are right, it takes 220 rides (or 44 days) to reach break-even on the scooter itself.
After 400 rides (when a scooter is written off), the company has generated $147 of profit, at a relatively meagre 10.3% profit margin.
Suffice to say: That doesn’t look like a particularly sustainable business.
Model 2: A more optimistic outlook
However, you don’t have to change the assumptions much for it to be a much more attractive business.
What if Bird was able to extend the life of a given scooter, decrease the average ride length but increase the average rides per day, and push more of the charging burden to consumers?
Let’s look at these dynamics:
- Average lifetime rides per scooter — 500
- Average rides per scooter per day — 7
- Average ride length — 20 minutes
- Percent of customer charges — 75%
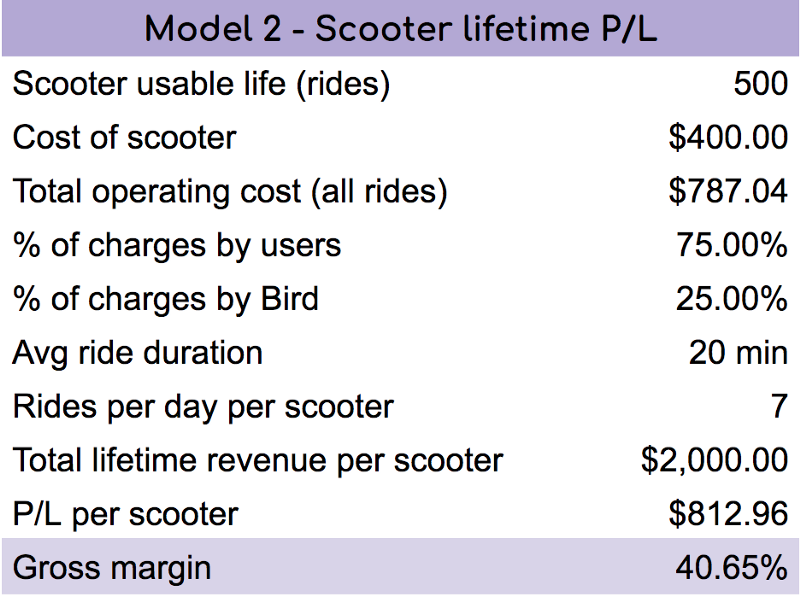
Changing these four variables means that it only takes 165 rides (24 days) to break even, and the lifetime profit of a scooter is $813 — or a gross margin of 41%.
So, do these unit economics make sense?
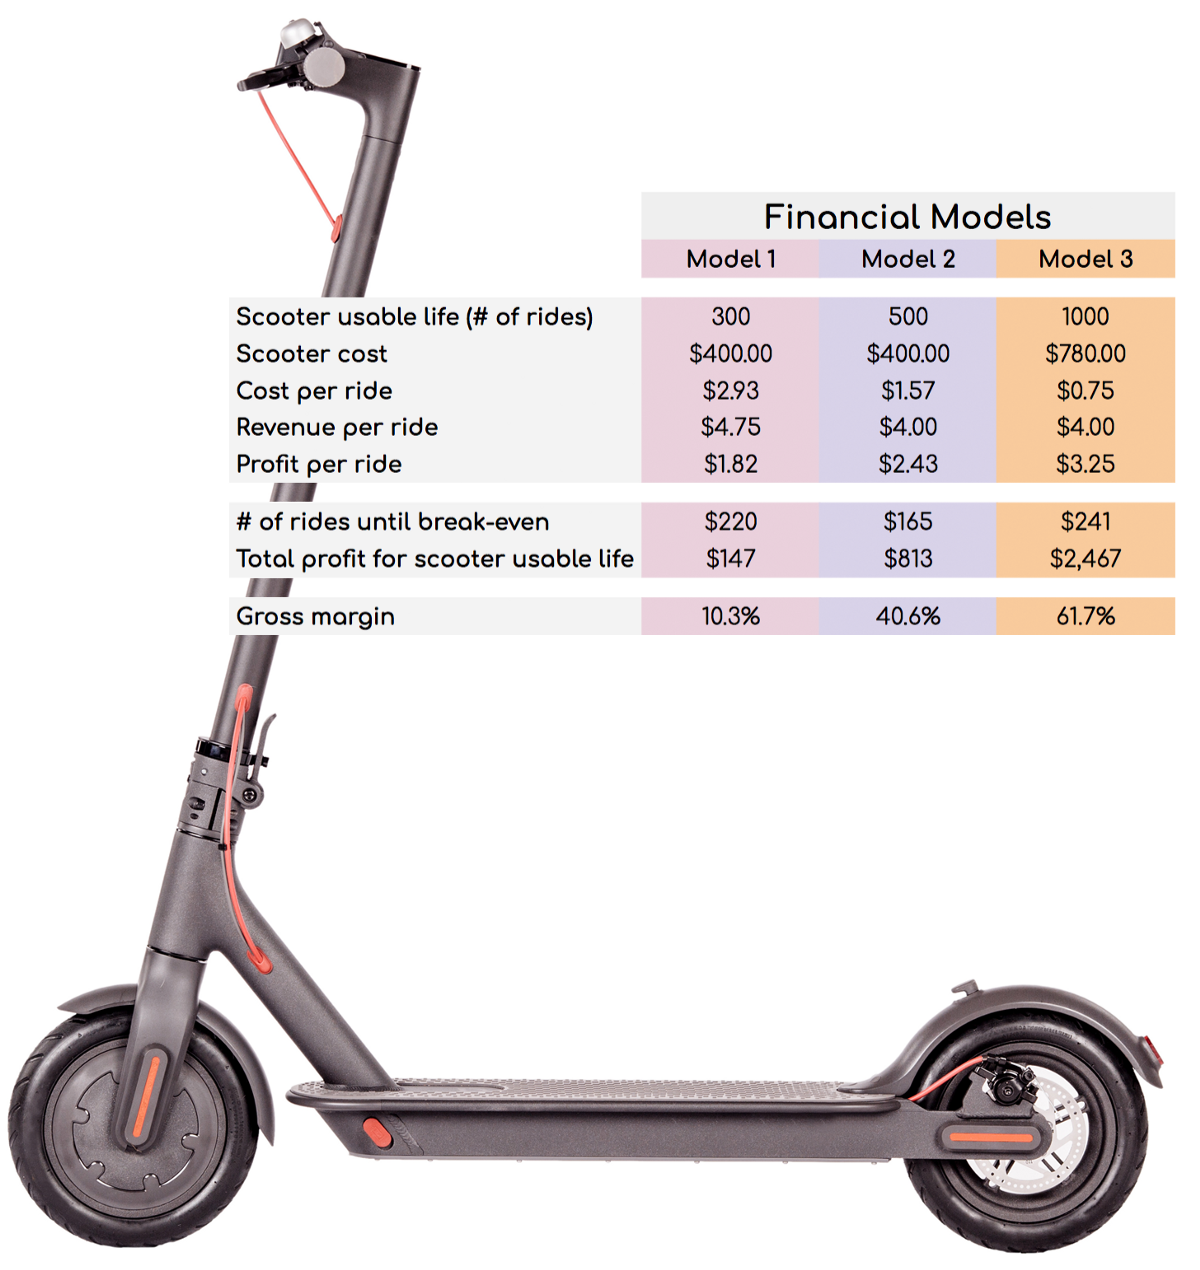
Investors certainly seem to think so. In February, Bird raised a $15m Series A, and only a month later, the company raised a $100m Series B. A company like Bird would be struggling to raise money on a 10.3% profit margin (as in Model 1), but if the numbers under the hood are closer to Model 2, it’s easy to understand how Bird starts to look like a rather attractive business.
Isolate variables to find your levers
In the case of Bird, you might be surprised to learn that three levers dramatically affect the finance model: average ride length, cost of charging, and usable life per scooter. Isolate variables and play with the numbers to figure out which ones are key levers.
Taking Model 2 above as a starting point, let’s explore by manipulating one set of variables at the time:
Ride length

Usable life / Longevity

Cost of charging

Pulling the levers: SuperScooters
Once you know your levers, it’s fun to pull them a bit. If we were to optimize Bird to be as profitable as possible, it might be tempting to try to influence people to ride longer. But how? People’s commutes are probably relatively fixed, and you’re unlikely to be able to get them to change their commuting route. As we saw in an earlier example, though, the cost of charging has a huge impact on the overall business. What if we could find a better way to solve that?
Model 3 — SuperScooters
Say there was a different scooter available on the market— a SuperScooter — with a swappable battery pack that clocks in at a hefty $1,000 MSRP.
The scooter has a higher up-front cost, but it’s more robust. Instead of a 500-ride lifespan, it has a 1,000-ride lifespan. The replaceable battery pack enables the Bird Service Crew to quickly replace scooter batteries out of charging racks in the back of the vans they’re already driving around town to redistribute scooters.
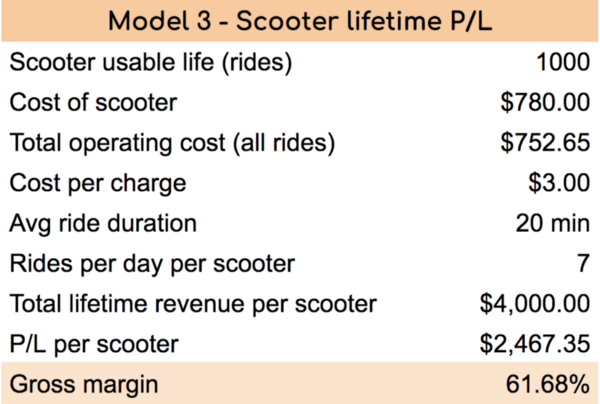
Let’s say that reduces Bird’s “recharging” cost to $3 per scooter per day, even cheaper than the consumer charge in Models 1 and 2, totally eliminating the need for consumers to charge the scooters at all.
In addition, let’s say Bird invents their own asset tracker that they can build for $30 per unit, rather than $80 off the shelf, and their manufacturer agrees to install it at the factory, taking the $20 in-house final assembly cost to zero.
By implementing the changes above, you end up with $2,467 profit per scooter, break-even at 34 days, and a gross margin of 62%. In other words: If such a scooter were available, it’d be a no-brainer: You’d want to replace the entire fleet as quickly as you could.
Build your model. Know your levers.
Obviously, I have grossly simplified the financial model here — if you were to model out the entire business of Bird, you would need to look at customer acquisition costs, customer lifetime value, churn, R&D costs of the elusive SuperScooter, and so on and so forth. Models get complicated quickly, but they also allow you to explore the impacts of changes you might make before you make them, which is invaluable.
Whatever your business, build a business model that includes all of your assumptions — and build the model so you can pressure-test variables and find your levers. Once you’ve identified them, build MVPs to test those assumptions in more detail. It’s really important to experiment early and get some good data on what works (and what doesn’t), before you start ramping up and pouring lots of money into marketing and execution. Some changes can have exponential effects — for better or for worse.
This article was originally published on TechCrunch
Bolt invests at the intersection of the digital and physical world.